Unit 6: Reading Graphs

Standard

Reading graphs is about understanding graphs that are showing 2 types of data.

The graphs are about having data for two variables (x, y) . Typically the two types of data are related in some way.

Below is a Scatter Plot with bivariate data. The two things that we are comparing are Temperature and Ice Cream Sales.

Here we have ice cream sales versus the temperature on that day. The two variables are Ice Cream Sales and Temperature.

(If you have only one set of data, such as just Temperature, it is called “Univariate Data, bivariate mean two types of data)

In this scatter plot you can see that as tempurate rises so do prices.

https://www.mathsisfun.com/definitions/bivariate-data.html

To find more information in Bivariate Data click here.


Click here and  here   and here and here to practice Identifying Scatter Plot Trends and Predicting with Best Fit Lines online and get automatic feedback (it grades it)! 🙂


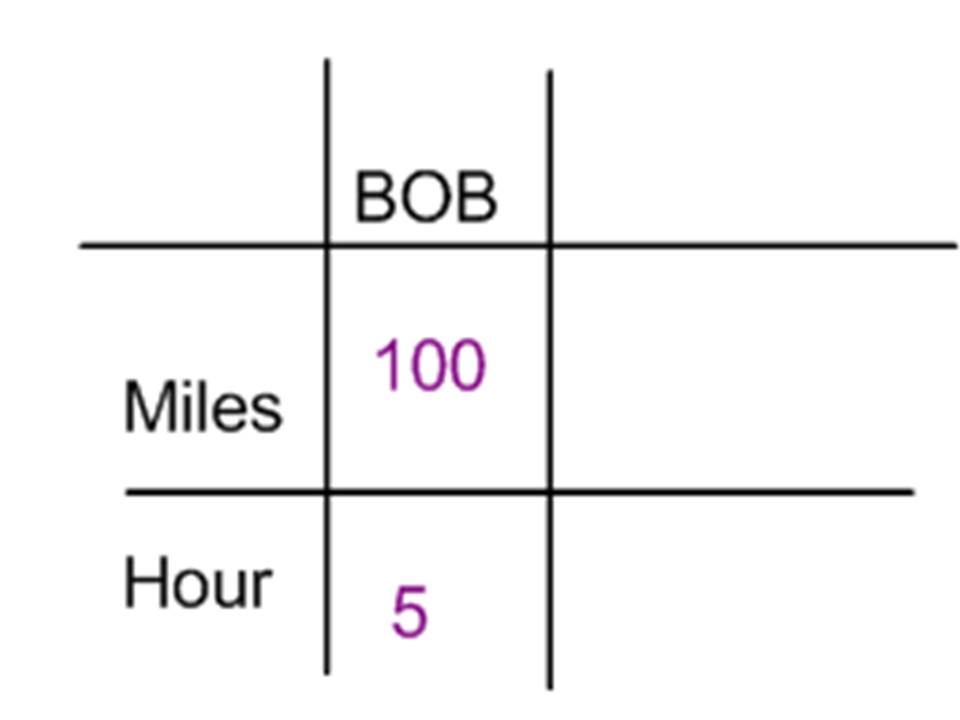
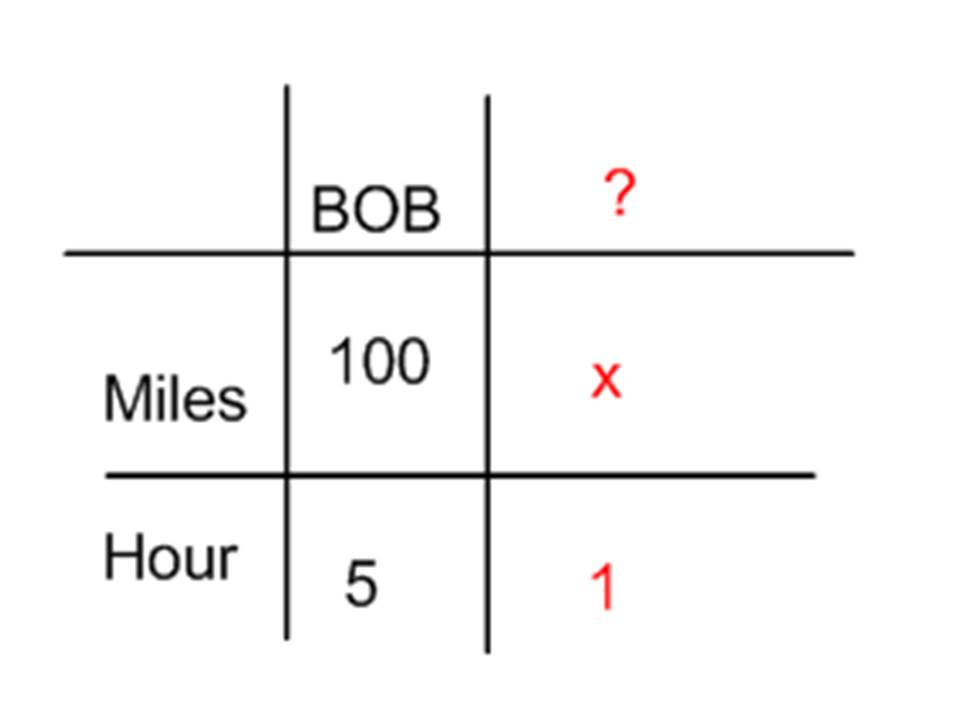
Writing Linear Equations
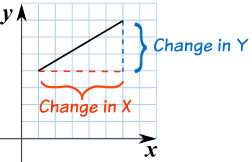
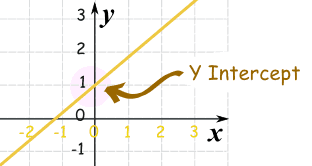
Slope Intercept Form:      y = mx + b

The variable m is the slope, it explains the steepness of a line.

The variable b is the y-intercept, this is where the line touches or intersects at the y-axis.

http://www.shmoop.com/video/slope-intercept-form/

Stations

Standard

Station # 1: Functions

https://www.ixl.com/math/grade-8/identify-functions

Click here to practice Functions

Station # 2: Unit Rate

https://www.ixl.com/math/grade-8/unit-prices

Click here to practice Unit Rate

Station # 7: Unit Rate

Click here to open the document to practice Unit Rate

Station #8: Graphing Lines

https://drive.google.com/file/d/0B7iseoIHkzatZWVjRnV1eDNTYVk/view?usp=sharing

Click here to watch the video and follow along

Unit 5: Proportional vs Non-Proportional Functions

Standard

Functions

A Function is Special

A function is a type of equation.

A function has special rules it must follow:

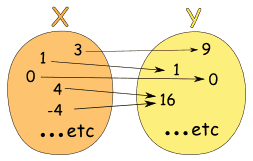
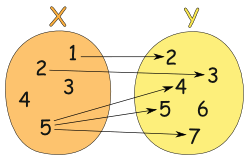
In a function there can ONLY be ONE output(y) for every input (x).

Just like I stated before, a Function is Special! 🙂

  • It must work for every possible input value
  • And it has only one relationship for each input value

function      function

THIS IS A FUNCTION!                  THIS IS NOT A FUNCTION!

***Think of the birthday example. Each person can only have 1 birthday, other people might have the same birthday as you but you have only 1. You are like the x (input) value and your birthday the y (output) value.***

Example: y = x²

FUNCTION

function

Could also be written as a table:

X: x Y: x2
3 9
1 1
0 0
4 16
-4 16

It is a function, because:

  • Every element in X is related to Y
  • No element in X has two or more relationships
  • The X values DO NOT repeat

So it follows the rules.

(Notice how both 4 and -4 relate to 16, which is allowed since 4 and -4 are two different numbers.)

Example: This relationship is not a function:

NOT A FUNCTION

function

This is not a function, for these reasons:

  • Value “3” in X has no Y
  • Value “4” in X has no Y
  • Value “5” is related to more than one value in Y
  • REMEMBER THE X VALUE CANNOT REPEAT

Find more information about functions here.

Find more information about functions here.

Unit Rate

Unit rates are about the amount for 1 unit.

We use Ratio Tables to help solve for rates.
Our Ratio table looks like a tic-tac-toe table.

rt
We MUST label our table to know where to put our information

Ex. Bob drives 100 miles in 5 hours. How many miles does he travel every hour?

Ratio Table

Now we fill in the information that is given.

Bob drives 100 miles in 5 hours. How many miles does he travel every hour?

Ratio

Once we have entered what was given we need to see what the question is asking us.

Ex. Bob drives 100 miles in 5 hours. How many miles does he travel every hour?

Ask yourself, is the problem asking how many hours it takes for 1 mile or how many miles for 1 hour???????

If you said how many miles for 1 hour, you are correct!

So now we enter that into our Ratio Table.

Rat

The x is the unknown. This is what we are solving for.

Rati

To solve for x, we multiply 100 and 1. Then divide by the number left over which is 5.

We end up with x = 20.

So Bob drives 20 miles per hour.

Click here to watch a video with a different way to find unit rate.

Test yourself on unit rates here!

Unit 4: Slope and Y-Interecept

Standard

Slope Intercept Form:      y = mx + b

The variable m is the slope, it explains the steepness of a line of how slanted the line is.

The variable b is the y-intercept, this is where the line crosses or intersects the y-axis.

https://www.desmos.com/calculator

http://www.shmoop.com/video/slope-intercept-form/

Slope: m

Slope is how steep a straight line is.
When finding the slope from a line on a graph we use the method of rise over run .
  • Rise is how far up
  • Run is how far along

rise over runn

You can also think of it as the change in y over the change in x.
gradient
EXAMPLE #1:
rise over run
The slope here is 4/6 which can simplify to 2/3.
EXAMPLE #2:
Slope
In this example the slope is 3/5.

For more information on slope click here.

Practice Problems

Get your SLOPE on!

TEST YOUR SELF ON LINES HERE!!!!

https://my.hrw.com/wwtb/api/viewer.pl

Here is a video of slope as a rate of change.

Y Intercept: b

Y intercept is where a straight line crosses the Y axis of a graph.

Example:

Y intercept

In the above diagram the line crosses the Y axis at 1.

So the Y intercept is equal to 1.

For more information on intercepts click here.

Practice Problems

Get your Y-intercept on!

Slope Intercept Form

y = mx + b

m = Slope (how steep the line is)

b = the Y Intercept (where the line crosses the Y axis)\

y=mx+b graph

How do you find “m” and “b”?

  • b is easy: just see where the line crosses the Y axis.
  • m (the Slope) needs some calculation. Remember to write slope as a fraction.

Example 1)

y=2x+1 graph

The fastest and easiest thing to find first when looking at a graph is the y-intercept (b).

Here we see that the line crosses the y-axis at positive 1.

So, b = 1 .

 Now to find the slope (m) we will use rise over run:

  • Rise is how far up
  • Run is how far along

In this example the rise is 2 and the run is 1.

So, m = 2/1 .

Now that I know m = 2/1 and b = 1 I can plug them into the equation for slope intercept form y = mx + b.

y = (2/1) x + 1

^^^^^ This is the equation of the line.
For  more information on y = mx + b click here.

 Practice Problems

Get your Slope Intercept on!